FED / FOMC
FED vs Market: 1:0

22-May-2023. FED vs Rynek: 1:0 dla FED-u.. jeżeli chodzi o obniżki stóp w USA (albo ich brak przez dłuższy okres), czyli to rację jak dotąd miał FED a nie rynek! Dzisiejsza krzywa kontraktów futures na Fed Funds przesuwa się do przodu „podążając za” projekcją ścieżki stóp procentowych podaną przez FOMC w dniu 22 marca br. (patrz wykres, czarna przerywana linia, jest trochę „krótka” bo dzisiaj rano na dalszych kontraktach nie ma jeszcze obrotów). Jeszcze 24 marca br. (dwa dni po publikacji projekcji FOMC), na szczycie paniki w związku z upadłościami banków regionalnych rynek wykluczał dalsze podwyżki i zakładał, że pierwsza obniżka nastąpi w czerwcu br. (tak to prawda, nawet jeżeli brzmi to teraz całkiem dziwnie..). Wnioski: (i) rynek zakładał/zakłada szybkie obniżki stóp procentowych w następnych 12-18 miesiącach, ale mogłoby się to wydarzyć głównie jeżeli coś na poważnie „pęknie” – przykładem takiego pęknięcia (ale nie na dobre) są właśnie banki regionalne; (ii) jeżeli nic na poważnie nie pęknie, to FED nie będzie skłonny „bez powodu” obniżać stopy jak prognozuje rynek (2:0 dla FED-u 😊); (iii) wtedy rynek będzie przesuwał swoją wycenę obniżek stóp do przodu.. (tak jak to zrobił między 24 marca a 22 maja br.); (iv) jeżeli nie powróci "panika" z wycofywaniem depozytów z małych banków (czyli np. rzędu 50-100 mld tygodniowo) to ciężko zakładać, że to tam… po stronie depozytów.. ma coś pęknąć (strona aktywów to co innego) – przynajmniej na dzisiaj nic specjalnego z depozytami w małych bankach się nie dzieje.. raczej nuda.. (patrz wykresy: łączne depozyty w małych bankach, duże depozyty w małych bankach i pozostałe depozyty w małych bankach).


Powell's Hawkish Talk

16-Jun-2023. (Hawkish Powell’s) talk is cheap or expensive? Powell may already regret not raising rates on June 14… at least looking at stocks, whose increases "reverse" Fed hikes by easing financial conditions… The stock market has stopped worrying about inflation since the beginning of May – which can be seen in the broken correlations between: (i) S&P500 – UST bond yields, (ii) EURUSD – S&P500, (iii) Nasdaq100 – real 10Y yield. These correlations have held almost "perfectly" since the beginning of 2022. Hence the conclusion that the stock market has changed its regime from “inflation” to “disinflation”. If the pause in the rate hike cycle began on May 3 (not much will change if the pause begins on July 26), today's strong increases in stocks are not a big surprise if we compare it to the Fed's disinflationary rate-hike cycles (1989, 2006 and 2018) - see charts. In the inflationary cycles (1969, 1974, 1981) the S&P 500 fell immediately after the last rate hike by the Fed, (today we should be on the S&P 500 -7% instead of +7% - starting from May 3) - see charts. But we also have an exception to the above "rules" of deflation and inflation cycles, especially for people comparing the current market to 1999 ... then after the burst of the dot-com bubble in 2000, despite the pause of the Fed and the non-inflationary cycle ... the S&P 500 continued to fall ... even FED rate cuts didn't help... see chart.


Wu-Xia Model

23-Jul-2023. The Fed Funds Rate is now at its highest since 2001! If we take into account the shadow rate (e.g. according to the Wu-Xia model, see the chart), the FED rate has already increased by 7.4 percentage points in this cycle! Bigger raises were only in the 70's! The most frequently repeated phrase during today's Powell press conference was the statement that the FED is data dependent and subsequent decisions, at subsequent meetings, will be made based on the incoming data ... But if the S&P500 is a few percent higher on September 20, maybe on the new ATH, the unemployment rate will not be higher than 3.7%, headline inflation will bounce back from today's levels (we are at the end of the positive base effects, and the price of WTI oil is almost USD 80, and there will be two more inflation readings before the next FOMC meeting).. then the FED may be tempted for another hike… despite the fact that today the consensus easily claims that today's hike is the last in this cycle...
FOMC: 20-Sep-2023

20-Sep-2023. Today's FOMC: rates unchanged as expected, but the median projected rate in 2024 is "unfortunately" as much as 50 bps higher than in the June projection: it is really H4L (higher for longer). Today's market reaction (from the announcement of the FOMC decision to the close): 10Y: +8 bps (hawkish) 2Y: +10 bps (hawkish) S&P500: -1.16% (hawkish) EURUSD: -0.60% (hawkish) But on the other hand, the FOMC almost never gets it right with its projections (see the chart with projections since 2012 against the actual Fed Funds Rate) - so FOMC projections shouldn't matter too much beyond the short-term reaction of markets.


Post-FOMC fallout: Day 2

22-Sep-2023. Post-FOMC fallout. Day 2. Summary of the main asset classes. Day 1 (from the announcement of the FOMC decision to the close) + Day 2 (at close) + Day 3 (intraday, this morning) = total US Treasuries: massive bear-steepening: 10Y: +8bps +10bps + 0bps = +18bps 2Y: +10bps - 3bps + 0bps = +7bps US Equities, hawkish: S&P500: -1.15% -1.64% +0.2% = -2.6% Nasdaq100: -1.43% -1.84% +0.3% = -3.0% EURUSD: -0.59% -0.04% -0.07% = -0.70% (hawkish) Two main conclusions: 1) The market reaction is like in a classic inflationary regime as in the cycles of the 1970s: stocks and bonds fall together, see the two charts for the S&P500 and 10y UST respectively. Currently, according to the market, we already have a pause (the probability of an increase on November 1 is only 26%, and on December 13… 45%), and the first rate cut will only take place at the FOMC meeting on July 31, 2024. 2) It is better for the American consumer to slow down relatively quickly, otherwise the FED is definitely going to “out-hawk” RoW (rest of the word), and the strengthening USD will only contribute to more troubles ahead for the RoW in the first instance (see the chart of the main currency pairs).


Different Fed Funds Paths

7-Nov-2023. Different Fed Funds Rate paths. The chart shows various paths of the future Federal Funds Rate: 1) from the moment "something just broke" - which took place on March 24, 2023, at the epicenter of the crisis of US regional banks, 2) until "nothing will break in the near future” or max higher-for-longer narrative - i.e. the most aggressive valuation of the FED’s rate path by the market (October 17, 2023). But the FOMC itself was even more aggressive with its projection as of September 20, 2023. Either way, the market has always had trouble predicting the future path of the Fed Funds Rate.
How Long Can The Pause Last?

9-Nov-2023. How long can the Fed's pause last? In 2018-19, the pause lasted 7 months, then there were 3 rate cuts and a recession (6.5 months after the end of the pause). In 2006-07, the pause lasted 14.5 months, then there were 2 rate cuts (by a total of 75 bps) and a recession (3 months after the end of the pause). In 2000-01, the pause lasted 7.5 months, then there were 2 rate cuts (by a total of 100 bps) and a recession (2.5 months after the end of the pause). In 1989, the pause lasted 3.5 months, then there were 5 rate cuts (by a total of 150 bps) and a recession (13 months after the end of the pause). According to Fed Funds futures contracts, the first rate cut will be June 12, 2024 - then the pause would last 10.5 months. Details on the chart.
FOMC Projection Error

14-Dec-2023. Policy path projections of Federal Reserve Board members. Since 2012, we have already had 48 projections of the future policy path available. What is their accuracy vs actual future interest rate? Figure 1 shows the average forecast error depending on the number of quarters that have passed since the FOMC meeting. After 1 year, the average error is 1.1 percentage points (maximum error 4.3 points), After 2 years the average error is 1.7 points (max 5.3) After 3 years the average error is 1.7 points (max 3.0). In the case of the "Longer run" forecast, I assumed that each such forecast is 2 years ahead of the longest available forecast at the end of the calendar year. Figure 2 shows the most accurate projection in data history (FOMC as of June 15, 2016). Figure 3 shows the least accurate projections (FOMC of September 26, 2018 and September 16, 2020).


13-Dec-2023 FOMC Meeting
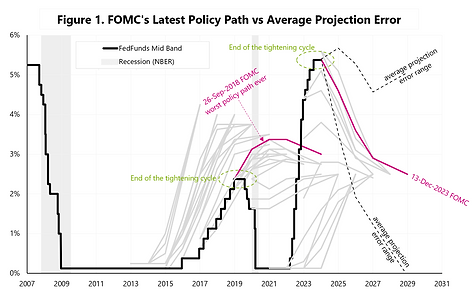
17-Dec-2023. Confused by the FED? December 1: J. Powell: “It would be premature to ... speculate on when policy might ease”, December 13: J. Powell: Rate cuts are something that “begins to come into view” and “clearly is a topic of discussion”, December 15: J. Williams: “I just think it's just premature to be even thinking about (rate cuts)”. So it's rather difficult to rely on what the Fed says... It is also difficult to rely on their forecasts regarding the future policy path. Figure 1 shows the latest median path with the range of the average forecast error plotted (average error based on 48 policy paths published to date since 2012). Link to the analysis below the text. It is also difficult to rely on basic economic data such as the change in nominal GDP or the change in core inflation (Figure 2). In this case, the Fed appears to be responding quickly to lower GDP growth (2008, 2020), but is not willing to respond to higher GDP and higher inflation (unless it no longer has a choice...). It is also difficult to rely on the Taylor's Rule (Figure 3), which in Q4 2021 suggested the FED's rate at 8.5% - while the FED kept insisting that inflation was temporary, keeping rates at zero and conducting QE. Go figure. Trade accordingly.


14-Dec-2023. FED’s Policy in 2024.. There ya have it folks... After yesterday's FOMC meeting, markets received a large dose of clarity regarding the Fed's policy in 2024. Just look at yesterday's reactions of the stock market (S&P500 +1.37%), US rates (UST 10y: -18 bps; 2y: -30bps) and the dollar index (-0.95%). As far as FED's dot-plot is concerned.. the peak hawkishness was on September 20, 2023. Figure 1. The latest path from December 13 is much lower... this is one of the reasons for such a market reaction... That's all fine, but what are the chances that inflation will spoil the party in the second half of 2024 / 2025? So what about fiscal policy in 2024? Unfortunately, we don't have a dot-plot here... but the latest data for November shows spending increased as a % of nominal GDP. In November, Total Federal Outlays amounted to $588.8 billion (+17.6% YoY), while the sum of these expenditures for the last 12 months amounted to $6.29 trillion and represented 22.7% of today's nominal GDP. Figure 2 shows this series against the annual change in inflation. The current 22.7% looks safe... but in March 2021 it was 33.7% of GDP! What is the pre-pandemic norm? The average for 2014-2020 is 20%. What’s the average annual change in inflation for 2014-2020... try… 1.56%. See Figure 3. Figure 3 shows government spending moved forward by 13 months... against the annual change in inflation. The question is, what are the chances of returning to 20% next year or any time soon?


Taylor Rule

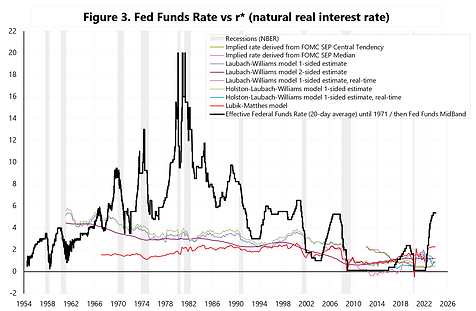
20-Dec-2023. Taylor Rule. Part 1. The Taylor Rule/Principle is a popular approach to estimating the central bank interest rate. It was proposed by Professor John Taylor of Stanford University in 1993 (link below), and can come in many varieties, but generally we can think of it as the sum of three variables: (i) Long-term central bank interest rate, (ii) +/- Correction due to current inflation above/below the inflation target, (iii) +/- Correction due to current GDP (growth) above/below potential GDP (output gap). Today a little bit about point (i). Nowadays it is widely accepted that the ideal (target) level of inflation is 2%. But the central bank rate cannot be at 2%, because this would mean that the real central bank rate would be 0% (doesn’t make sense). Therefore, to inflation target rate of 2% we should add the natural real interest rate, i.e. r*. What is r*? If we look at the latest FOMC economic projections (link below), the median expected longer run inflation is 2.0%, and the federal funds rate longer run is 2.5%... hence the conclusion that r* is (according to such a projection) 0.5%. This is just one method of estimating r*. FOMC projections are only available from 2012, so to calculate r* over a longer period of time, we can use various models. But where should the Fed rate be if we assume that (i) inflation is on target and (ii) economic growth is equal to potential GDP growth. Figure 1 shows this rate over time. Interesting conclusions can be drawn, e.g. that since 2010 we have had (as a combined effect) inflation below the target and a negative output gap (growth below potential). Of course, if inflation is above the target, the FED rate should increase, and similarly if GDP growth is above potential, the FED rate should additionally be higher. Figure 2 is a similar chart but from 1954. In this case, R* is the average of the estimates of 3 different models (see the chart for details). Figure 3 shows different estimates of the real natural interest rate r* over time. Below a link to a previous publication about Taylor Rule.

Post-FOMC Day (1-Feb-2024)

1-Fep-2024. This time it was the FED’s day. Feeling a little lost? No worry. This could be normal on a day like this. Each investor (bull, bear, etc.) got something for themselves and their base-case investment scenario… What happened? Stocks: S&P500 -1.67%; Nasdaq100 -1.94%, Russell 2000 -2.45%, Microsoft -2.71% (first day after earnings), Alphabet -7.55% (first day after earnings). An additional attraction is the New York Community Bank (NYCB), which fell by 37.7% (first day after earnings), what resulted in the KRE regional bank index (SPDR S&P Regional Banking ETF) falling as much as 5.85%, Yet, here were also positives such as Novo Nordisk (first day after results) +5.25%. In the case of US treasuries, we had a massive bull-steepening day: 2Y -12.6 bps, 10Y -12.0 bps, 30Y -8.0 bps. In order not to lose the big picture, let's look at what happened pre-FED: stocks had already started a correction, reacting negatively to the blowout Microsoft earnings and strong Alphabet’s ones. The tragic results of the NYCB contributed to the correction, also dragging down other regional banks amid fears of a possible repeat of the March 2023 crisis. Yet, in the case of bonds, it was practically a perfect day (pre-FED) for falling yields: starting with soft inflation in Australia, Germany, but also in France. Then in the USA we had a weaker than expected ECI increase (Employment Cost Index - an important data point), lower employment growth according to ADP and a decline in Chicago PMI. Additionally, the QRA announcement (UST bond supply structure) turned out to be in line with market expectations. However, falling NYCB shares caused a massive bull-steepening of the yield curve. Then came the FED, the Hawkish FED. As usual on such a day, thousands of investors from all over the world analyzed every sentence in the FOMC Statement and listened carefully to every Powell's word during the presser... We got a lot of volatility during Powell’s presser. Yet in my opinion, there are two arguments that this does not mean too much right now: firstly, there is still a lot of time to the next FED's meeting on March 20 (it remains to be seen if there will be a rate cut) and secondly, markets know how big the difference can be between what the Fed says and what it does... (just remember the FED’s pivot from December 2023). Figure 1 shows yesterday's reaction of two major asset classes: US stocks and bonds. Figure 2 shows the TLT (iShares 20+ Year Treasury Bond ETF) performance from the rates cycle bottoms.

Wealth Effect (Sep-2024)

14-Sep-2024. Wealth effect on steroids! One of the reasons for the strong US economy, or strong American consumer, is the "wealth effect". Below is the definition of "wealth effect" according to Investopedia: "The wealth effect is a behavioral economic theory suggesting that people spend more as the value of their assets rises. The idea is that consumers feel more financially secure and confident about their wealth when their homes or investment portfolios increase in value. They are made to feel richer, even if their income and fixed costs are the same as before." Total US household assets in Q2 2024 amounted to $184.5 trl, and Net Worth $163.8 trl - see Figure 1. The higher the level of Net Worth as a % of GDP - the stronger the "wealth effect" can be. We are currently near maximum levels .. above 600% - see Figure 2. But the rate of wealth growth also matters... and since Q1 2020 Net Worth has been growing at an annual rate of +9.6%. This is significantly faster than the previous expansion from 2009 to 2020, when the annual rate of growth of Net Worth was “only” 6.4%. See Figure 3. The main components of household assets are stocks and real estate. Both the S&P500 and the S&P CoreLogic Case-Shiller U.S. National Home Price Index have risen significantly since 2020 (see Figure 4): -S&P500 +128% (from Q1 2020 lows), -Case-Shiller U.S. National Home Price Index +47% (June 2020 to June 2024). The wealth effect has one drawback… it works both ways. Perhaps the lack of further growth in stock and house prices could already be seen as a net drag on economic growth? Or maybe we need falling stock and home prices before the next recession in the real economy… aka the “reserve wealth effect”?


FOMC's Sep-2024 Preview

18-Sep-2024. Full-throttle soft-landing? FOMC’s First Cut Preview. If the US economy remains strong and the US consumer continues to spend heavily, then the recent recession fears should not come true anytime soon. Yet, rate cuts should fuel a "soft landing" scenario, and inflation, if it is to return, will probably not return until Q2/Q3 2025 at the earliest. Is this a good environment for stock market growth? This is not a classic soft landing from the 90s, but the comparison to 2019 rhymes better... In 2019, after three interest rate cuts, the S&P500 rose by another 19% from the August 2019 low to February 2020! See Figure 1. Is the US economy strong? The Atlanta FED GDP tracker indicates growth in Q3 2024 of around 2.93%! This is probably not a recession. See Figure 2. But in 2019, the FED began cutting rates with GDP growth in Q3 2019 of around 4.61% SAAR. Is the US consumer spending a lot? The Atlanta FED PCE tracker indicates a +3.65% increase in real consumer spending in Q3 2024! Similarly, in Q3 2019, the consumer accelerated to +4.13%. See Figure 3. Figure 4 shows the nominal series related to consumer income and spending. The low savings rate is one source of higher spending. Nevertheless, the labor market is gently slowing down. It was also slowly slowing down in 2019 (four months of readings below 100k). See Figure 5. Figure 6 compares Initial Claims, Continued Claims and Unemployment Rate U3. In the current cycle, the most risky outlier is the unemployment rate at 4.1%. If the labor market continues to slow, this will be the biggest risk to the soft landing scenario.


Post-FOMC Fallout Day 3

24-Sep-2024. 3 trading days after the FED – who wins, who loses? The dust is slowly settling after the FED's historic decision. How are individual asset classes doing? – see Table 1. Stocks are winning and bonds are losing. The dollar weakened at first, but today it strengthened after the ugly European PMIs (so the balance is at zero). In terms of stocks, the Nikkei225 (+3.7%) and Hang Seng (+3.3%) are winning, but so is the Nasdaq100 (+2.1%). Gold +2.2% and Bitcoin +5.7%! From currencies, the Yen weakened and the Chinese Yuan strengthened. The 10Y UST yields rose and the 2Y fell. The FED lowered the rate by 50 bps, but also significantly lowered the path of the projected future rate – see Figures 1 and 2. However, the (historical) accuracy of such a forecast/path is low. The Fed also lowered its own PCE inflation projection – see Figures 3 and 4. The Fed also raised its own unemployment rate projection – see Figures 5 and 6.


Post-FOMC 18-Dec-2024

22-Dec-2024. Is the next Fed’s pivot coming in 1H 2025? The ultra-dovish Fed surprised markets on September 18 with a jumbo cut (50 bps)… and 3 months later, on December 18, the ultra-hawkish Fed surprised markets in the opposite direction.. So what happened with inflation in those three months (Figure A). 1) Headline CPI rose from 2.59% (SA) to 2.73% - a mere 14 bps. 2) Core CPI rose 3 bps (from 3.27% to 3.30%). 3) Headline PCE inflation fell from 2.47% to 2.31% - a 16 bps. 4) Core PCE rose 12 bps (from 2.67% to 2.79%). No wonder the markets were surprised by the Fed’s hawkish pivot, it’s hard to expect such a sharp change in policy based on such changes in inflation… In addition, the Fed is also quite wrong in its projections. Figure 1 and 2 show the median projected Fed Funds Rate. Figure 3 and 4 show PCE Inflation. Figure 5 and 6 show Core PCE Inflation. Figure 7 and 8 show GDP. Figure 9 and 10 show Unemployment Rate.


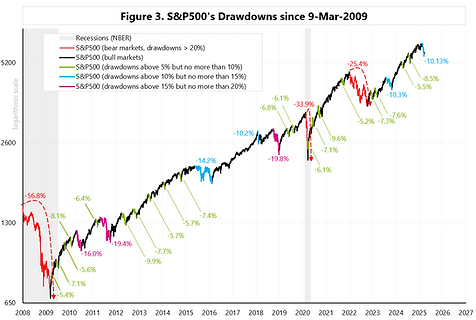
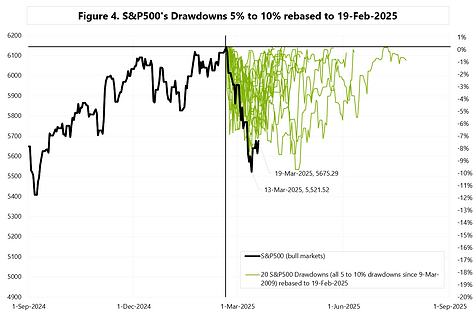
FOMC 20-Mar-2025

20-Mar-2025. Trump’s tariffs and Powell’s put. It was supposed to be a boring FOMC meeting, but as a result we have a quite dovish reaction of the markets. The Fed lowered the real GDP growth at the end of 2025 from 2.1% to 1.7% (Figure 1) and increased Core PCE, but only as of the end of 2025 from 2.5% to 2.8% (Figure 2). The increase in inflation is due to the trade wars and tariffs… and similarly to 2019, inflation is supposed to be temporary. Which may ultimately mean interest rate cuts similarly to 2019… (the result of weaker growth and temporary inflation). The S&P500 after a 10.13% drawdown (Figure 3) is slowly making up for losses. Figure 4 shows all 20 drawdowns (from 5% to 10%) since 2009 – which have been recalculated to the S&P500 level on February 19, 2025. Figure 5 shows the drawdowns from 10% to 15%. And Figure 6 shows the drawdowns from 15% to 20%. All-in-all, for both the markets and the Fed, the most important thing remains tariffs and the general uncertainty generated by the Trump administration. Bonus Chart: S&P500 bear markets of 2020 & 2022 (Figure 7).