Global Inflation
top 3 charts


7-Jan-2024. Core inflation should remain the main determinant of monetary policy in terms of the inflation data impact on policy. If we were to see some negative surprises, it would be closer to H2 2024.
7-Jan-2024. Change in core inflation year-on-year. In CEE countries, the dynamics are of course higher, but they will not affect the global sentiment. Core inflation in the US to be more closely watched. Some European countries have already released preliminary inflation data for December (based on local methodology, Eurostat will publish HICP data in mid-January). Based on local Polish flash data, it can be estimated that core HICP inflation increased in December in Poland by approximately +0.25%. This gives a decline in the annual dynamics to 5.89% (from 6.20% in November).
7-Jan-2024. The 3-month annualized rate in core inflation remains below 2% in EA, Czechia, Hungary and China. In Poland it jumped to 3.40% in December (estimate). In the USA, it also remains relatively high, as much as 3.39%. In Japan as much as 3.82%.
Core Global Inflation Sep-23

18-Oct-2023. Core Inflation (CEE, Euro Area, US) and “major” deflation in Czechia Core Inflation rose much more strongly in CEE countries, from December 2019 to October 2023: Hungary +35%; Czechia +35%; Poland +31%; Romagna +26%. For the same period in the Euro Area (EA) only +12% and in the US +17% respectively (see chart 1). However, the situation is heading in the right direction... the last 3-month increases in core inflation (3-month annualized rates, chart 2) range from -0.84% (Czech Republic) to 3.58% in Poland. The exception is Romania with a 3-month annualized rate at stunning +18.4%. In Romania, monthly changes in core inflation are quite high, and in addition, in August we had increases in drug prices by 21% in one month, which resulted in a jump in core inflation only in August by +2.47 MoM. Conversely, in the Czech Republic we have "serious" deflation: all 4 main series (headline, core, energy & food) are negative on a 3-month annualized basis! - see chart 3. Could this be what awaits us in 2024? If virtually most central banks were wrong in 2021 by claiming that inflation is temporary, why couldn't it be the same now... most say that inflation is with us higher for longer...


Polish Inflation Nov-2023
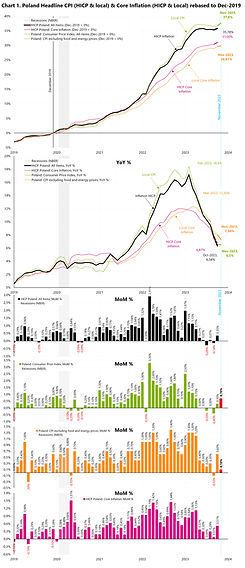
30-Nov-2023. Poland November Inflation. Good News: Monthly Core CPI only +0.1% MoM (estimate) Bad News: Monthly Headline CPI +0.7% Annual inflation slowed to 6.50%, while core inflation slowed to around 7.3% (estimate). The first chart compares local inflation to the HICP (here data until October 2023). The best is already behind us... a period of rapid inflation decline in Poland, which is also visible in the rebound in 3-month annualized inflation rates - see the second chart.

Euro Area Nov-2023 Inflation
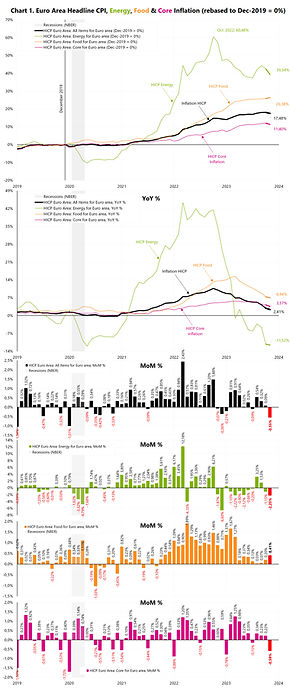
1-Dec-2023. Euro Area November (Dis-) Inflation. Headline monthly CPI for Euro Area: -0.55% Monthly Core CPI: -0.59% Energy monthly: -2.25% Food: +0.41% And the last 3-month inflation, at annualized rates: Headline CPI: -0.55% Core CPI: -0.55% Energy: -7.34% Food: +2.76% Today's dovish inflation data in the euro zone has raised expectations for the ECB rate cuts next year, bringing forward expectations for the first cut from May to April. At this moment, the market is practically pricing in 5 interest rate cuts (25 bps each) in 2024.

Nov-2023 Inflation in Europe

19-Dec-2023. What has really happened since the pandemic can be shown by the cumulative change in inflation, e.g. since December 2019. The highest cumulative inflation is in Hungary +46.1%. Second place Poland +36.6%. The lowest cumulative inflation is in Switzerland, only +4.94%. For the Euro Area +17.5%. Details on the chart.

Japan Nov-2023 Inflation


9-Dec-2023. Japan Inflation. Is inflation in Japan really a reason for the Bank of Japan to end its loose monetary policy relatively quickly? Last week, the yen strengthened significantly and bond yields jumped following Kazuo Ueda's comments on the future path of monetary policy. However, on the other hand, the market appears to have ignored the weaker November inflation reading for the Ku-area of Tokyo (widely considered to be leading for all-the-country inflation released later in the month). Additionally, on Friday, Reuters, based on its sources, reported that recent softness in consumption has presented itself as a source of concern for BoJ policymakers. Let's look at Japan's inflation data. The current spike in inflation (4.39% YoY in January 2023) has led to the highest headline inflation since July 1981 - Figure 1. In the case of core inflation (all litem less fresh food), we had the highest inflation (4.20% YoY in January 2023) since September 1981. In the case of the second measure of core inflation (all item less fresh food and energy), the highest inflation was in June 2023 (4.30%) – and this is the highest since June 1981. Figure 2 shows inflation since 2006. Inflation for the entire country for October 2023 was quite hot. Particularly strong monthly increases, starting with the headline (0.85%) and ending with Fresh Food (for the second month in a row above 5%) - see Figure 3. However, inflation for November for the Tokyo area turned out to be quite lower. None of the main measures increased in November (MoM: headline -0.28%; core inflation 0.00%; food -0.95%, fresh food -6.59% and Energy -0.71%). More about this inflation in part two.


9-Dec-2023. Japan Inflation. Part 2. Inflation in the Tokyo area for November 2023 was released on December 5, while inflation for the entire country will be known only on December 22. However, inflation in the Tokyo region is strongly correlated with the rest of the country, so it can practically be said that inflation for November is already in prices. See Figure 1. Headline year-on-year inflation in the Tokyo region decreased from 3.19% to 2.60% (monthly change -0.28%). Core inflation decreased from 3.83% to 3.63% (monthly change 0.0%). Fresh Food inflation decreased from 16.44% to 9.47% (monthly change -6.59%). And Energy inflation decreased from -14.22% to -16.65% (monthly change -0.71%). Figure 2 shows a comparison of core inflation since December 2019, and YoY for Japan, the USA, the Euro Area and Switzerland. Why Switzerland? Because Switzerland has the lowest inflation in Europe and is very similar to Japan in this respect. Comparing inflation to other countries, it is difficult to say that Japan has a problem with inflation. Additionally, the data for November looks encouraging. Hence the conclusion that unless inflation increases significantly, it should not significantly affect the monetary policy of the BoJ. Some policy tightening will occur, but it should be relatively gradual and small compared to other countries.

Japan Dec-2023 Inflation

21-Jan-2024. Core Inflation - comparison of selected countries. On Friday, we got the December inflation data in Japan (for the entire country). We can now compare recent trends in core inflation across major countries and the CEE region. Figure 1 shows a simultaneous comparison of annual dynamics and for the last 3 months (annualized rate). On a 3-month basis, China, the Eurozone and the Czech Republic are on the verge of deflation. On a 3-month basis, core inflation in Poland was below 2% only in one month (September), and in Hungary only for 2 months and now returned above 2% threshold. In the US, core inflation is still relatively high. In Japan, on a 3-month basis, we dropped below 2%. In Japan, we get the inflation from the Tokyo region much earlier in the month, which has a very high correlation with inflation in the entire country (Figure 2). The monthly change in core inflation in Japan is also interesting (Figure 3)... there was virtually no monthly inflation in November and December. The high monthly change from October will drop out from the calculations of 3-month inflation in the next month. The Bank of Japan meeting will take place next Tuesday + the release of its latest Outlook Report containing board members' median forecasts for real GDP and core CPI. The upcoming meeting is unlikely to involve any policy change, but there could be some interesting downgrading of inflation outlook for FY24 to the mid-2% range.


Japan Jan-2024 Inflation

27-Feb-2024. Inflation in Japan for January (for the entire country) turned out to be hotter than expected (Figure 1). - Headline CPI in January was 2.10% (expected 1.9%), - Core inflation (ex-fresh food and energy) 3.52% (expected 3.3%), - Core inflation (ex-fresh food) 2.01% (expected 1.8%). After the publication, the yen strengthened slightly against the dollar (but only by some 0.1% immediately after the publication), which can be considered a lack of reaction. Maybe because the main trend in inflation is relatively clear - see Figure 2. The 3-month annualized inflation rate is: - for headline CPI: -0.74% - for core CPI: 0.00% - for core (only less fresh food): 0.00% Figure 3 shows the above 3 series from 2006 (YoY).


Tokyo Mar-2024 Inflation

29-Mar-2024. Today we got the inflation in Japan for the Tokyo region Inflation for all of Japan will be known at the end of April, but it will be practically the same as in the Tokyo region - Figure 1 and Figure 2. Headline CPI YoY increased to 2.59% (from 2.50% in February), while Core YoY decreased to 2.91% (from 3.12% in February). Generally speaking, the March data show that inflation is starting to become a bit sticky. The monthly change in core inflation in March is +0.28% (in February +0.19%)! – Figure 3. With rising Energy and Fresh Food prices, the monthly headline CPI change was as much as 0.37%! But this is exactly what the BoJ expects, to get inflation stable at the 2% target (toward the end of projection period, which is March 2026). Such inflation will allow for a withdrawal from non-standard monetary policy, and the virtuous cycle from higher wages to higher spending will boost the economy. Unfortunately, one may have doubts… How do Japanese policy board members view all this? Just take a look at the SOO (Summary of Opinions at the Monetary Policy Meeting) we got yesterday… and more on that in the next post.


CPI Index since 1950

14-Sep-2023. US inflation - a longer perspective. By looking only at the annual change in inflation dynamics, we lose sight of what is really happening with inflation in the longer term. Therefore, in the attached chart I present the US CPI and Core CPI indices since 1950 (logarithmic scale). The change in the slope of the curve shows "different inflation regimes". For example, inflation clearly accelerated in the 1970s after the (temporary) departure from the convertibility of the dollar into gold (August 15, 1971), but inflation actually started to accelerate from 1966. Then we have a leveling off of inflation after 1982 and a further slowdown after the 1990 recession. Currently, it is also clearly visible how inflation has accelerated since 2021...
CPI Waves

14-Sep-2023. Can inflation move in waves? Yes. Historical examples are: - the years 1939-1951 (3 waves of inflation with peaks at 13.2%; 19.7% and 9.4%), and - the period 1966-1980 (3 waves with inflation peaks of 6.2%; 12.3 % and 14.8%). In the attached chart, these periods are superimposed on today's inflation..
US Core Services Sep-2023
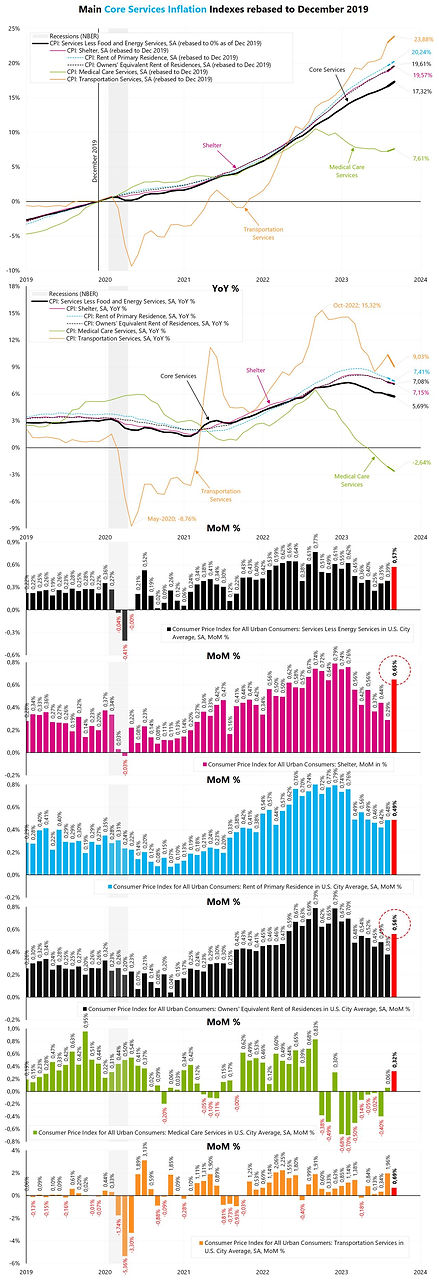
13-Oct-2023. US Core Services inflation. Core services inflation rose MoM +0.57%. As much as 59.6% of core services is Shelter, which shot up in September, growing MoM +0.65% (the strongest growth in 6 months, see the first chart). Shelter has a 34.749% weight in the entire CPI basket (core services inflation is 58.34% of the entire basket). Shelter consists of: (1) Rent of Primary Residence (7.59% of the total basket), +0.49% MoM and stable, relatively lower monthly increases over the last 7 months, (2) Lodging away from home (only 1.177% of the total basket), (3) Owners' Equivalent Rent of Residences, OER (25.613% of the entire basket) and here we have a strong increase of +0.56% MoM, the highest in 6 months - see the first chart, (4) Tenant's and household insurance (only 0.369% of the total basket), Rent of Primary Residence is the rental charge which consumers pay to rent their primary residence. OER is the rental equivalent homeowners expect to be paid if they were renting out their own home in the market. In practice both should be the same… However, they are both “lagging” as their measure "all leases”. Other measures, like for example “ApartmentList US National Rent Index” measures only “new leases”, which are of course leading by nature – see chart 2. Counting from December 2019, in September the prices of new leases were only about 2.2% higher than "all leases". YoY, this represents a decline of 1.3% for the ApartmentList Rent Index vs approximately +7% YoY for the official CPI basket measures (see chart 3). And it's only a matter of time before official rental measures cease to have a major impact on inflation...


US Core Services Oct-2023

14-Nov-2023. US Inflation. Part 5. Core Services. Also good data in this part of the inflation basket, although here there is more inflationary pressure in general. But headline Core Services rose in October only +0.34% (the lowest in 3 months). Shelter (as much as 34.863% of the entire basket) increased "only" 0.33% MoM. Some inflationary pressure can be seen in Medical Care Services +0.32% MoM (the last 3 months are positive, but the 3-month annualized rate is only +2.83%). There is also pressure in the case of the Transportation Services series, +0.89% MoM and as much as +14.81% for the last 3 months at annualized rate.

US Nov-2023 Inflation Preview

11-Dec-2023. US November Inflation. Tomorrow we will get US November inflation. Cleveland FED nowcast indicates a decline in annual inflation to 3.04% (the monthly change is expected to be -0.01%). The Wall Street expects 0% MoM and 3.1% YoY. But in other countries we already know inflation for November: China: -0.5% YoY (down from -0.2% in October), last 3-month annualized inflation rate: -2.77%, Japan (Tokyo area): 2.60% YoY (down from 3.19% in October), last 3-month annualized inflation rate: +3.45%, Euro Area: 2.41% YoY (down from 2.90% in October), last 3-month annualized inflation rate: -0.55%.

12-Dec-2023. US November Core Inflation. Cleveland FED nowcast indicates a small rebound in annual US core inflation to 4.06% from 4.02% in October (the monthly change is expected to be +0.33%). The Wall Street expects core inflation +0.3% MoM and 4.0% YoY. Other countries November print: China: +0.6% YoY (flat from October), Japan (Tokyo area): 3.63% YoY (down from 3.83% in October), last 3-month annualized core inflation rate: +1.53%, Euro Area: 3.57% YoY (down from 4.18% in October), last 3-month annualized core inflation rate: -0.55%. US 3-month annualized core inflation rate as of October is +3.36%. If we get a 0,33% MoM change in November, the 3-month annualized rate will increase to +3.58% (still ok). One need a 0,278% monthly change to get a flat reading on 3-month annualized rate.
Headline US Nov-2023 Inflation

12-Dec-2023. Headline monthly inflation +0.10%, a bit above expected 0.0% (Cleveland Fed nowcast expected -0.01%). In October monthly change was 0.04%. Figure 1. Headline YoY in line with expectations +3.12% (October +3.23%). Energy, down more than -2% for the second month in a row. Food only +0.22% MoM, the weakest growth in 4 months. Core MoM +0.28% (in line with expected 0.3%; Cleveland Fed nowcast expected +0.33%). Core YoY +3.99% (was 4.02% - this is seasonally adjusted series, in the case of an annual change, a not-seasonally adjusted series is usually cited, for which the annual change was still above 4%, specifically +4.007%). 3-month annualized rates (Figure 2 and 3): Headline +2.17% (+4.37% in October), Energy -12.33% (+19.5% in October), Food +3.07% (+3.14% in October), Core +3.39% (+3.36% in October).


FED vs Inflation

18-Dec-2023. How does the Fed fight inflation? One way to check is to compare whether the federal funds rate is below or above the annual change in core inflation (Figure 1). Interestingly, in the 1970s, the FED could not withstand the pressure and sharply reduced rates three times (these are the places marked on the chart as FED's errors). FED did not repeat this mistake in the 1980s, when, despite falling inflation, the federal funds rate remained above core inflation for a long time (until 1992). Powell's latest pivot raises the risk of repeating the Fed's mistakes from the 1970s. In March 2022, the difference between core CPI and the FED rate reached the highest value ever... The FED started the fight against inflation from a low level... Markets look at Core CPI and the FED looks at Core PCE (Core CPI is published earlier each month). But there is no major difference between these two series (Figure 2). Figure 3 shows the difference between the FED funds rate and the core PCE. Chart and conclusions similar to Core CPI. Interestingly, after the inflation adventure of the 1970s, the FED funds rate remained above Core PCE until 2002 (25 years).


18-Dec-2023. How does the Fed fight inflation? Part 2. We can also compare the federal funds rate to nominal GDP growth (Figure 1) and to the Taylor rule (Figure 2). The conclusions are similar to those for core inflation (both CPI and PCE) that the high interest rates in the 1980s helped ultimately defeat inflation. The question is whether the Fed will now keep rates higher for longer? These hopes were partially dashed after the last FMOC meeting. The Taylor rule, which estimates the central bank interest rate, appears in many versions, here I present the following one: the natural real interest rate estimated according to the Laubach-Williams 1-sided model, the inflation target is 2%, the inflation measure is Core PCE, and the real GDP gap according to CBO (Congressional Budget Office) estimates.

US Energy Nov-2023 Inflation
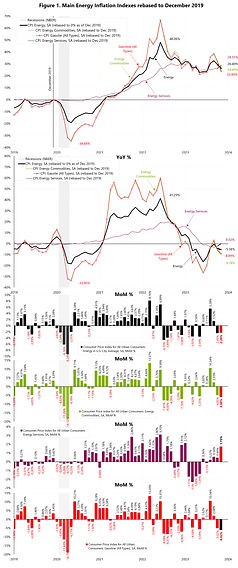
13-Dec-2023. US November Energy Inflation. Energy Inflation (6.963% of the total basket) consists of the following key series (Figure 1): 1) Energy Commodities (3.724% of the basket)... -5.80% MoM (was -4.85% in October) – the impact of only this series on the monthly change of the headline inflation amounted to -16 bps. Annual change of -9.78%. The main subcategory is Gasoline (all types) with a share in the basket of 3.438% - here MoM -6.02% and the impact of only this series on the monthly change of the overall inflation was -21 bps (the monthly change of headline inflation was +0.10%, i.e. 10 bps). 2) Energy Services (3.239% of the basket)... so this is really hot … +1.73% MoM and the strongest in 9 months. Annual change +0.02%. 3-month annualized rates (Figure 2): Energy (main series) -12.33% (+19.55% in October), Energy Commodities -29.21% (+34.20% in October), Gasoline (all types) -31.06% (+32.05% in October), Energy Services +11.57% (+5.09% in October).

US food Nov-2023 inflation

13-Dec-2023. US November Inflation. Food Inflation (13.42% of the total basket) consists of the following key series (Figure 1): 1) Food Away From Home (4.840% of the basket)... +0.43% MoM (was +0.37% in October) – so this is a little bit hot. The strongest growth in 5 months, annual change of +5.29%, 2) Food at Home (8.580% of the basket)... no inflation here for 9 months now.. +0.18% MoM and +1.66% YoY. 3-month annualized rates (Figure 2): Food (main series) +3.07% (+3.14% in October), Food Away From Home +4.92% (+4.54% in October), Food at Home +2.04% (+2.36% in October),

US core commodities Nov-23

13-Dec-2023. US November Inflation. Core Commodities Inflation (20.914% of the total basket) consists of the following key series (Figure 1): 1) Used Cars and Trucks (2.521% of the basket)... +1.58% MoM (was -0.80% in October). This is hot, after 5 months of price declines we have positive growth. YoY change still negative at -3.75%, 2) New Vehicles (4.231% of the basket)... no inflation here yet.. -0.06% MoM and +1.33% YoY, Figure 4 compares the inflation of Used and New Vehicles since 1953. It is interesting that car prices from the mid-1990s until the pandemic… they did not grow... and even fell in the case of used cars... 3) Apparel (2.549% of the basket) ... -1.29% MoM, the biggest decline since May 2020, yearly change only +1.19%. Such a decline subtracted as much as 3.2 bps from the monthly change in overall inflation. 4) Medical Care Commodities (1.465% of the basket).. +0.46% MoM, so on the hot side.. yearly change +4.98%. 3-month annualized rates (Figure 2 and Figure 3): Core Commodities (main series) -3.08% (-2.28% in October), Used Cars and Trucks -6.94% (-16.84% in October), New Vehicles +0.59% (+1.93% in October), Apparel -7.56% (-1.83% in October), Medical Care Commodities +2.38% (+2.78% in October).


US core services Nov-2023

12-Dec-2023. Core Services Inflation (58.703% of the total basket) consists of the following key series (Figure 1): 1) Shelter (34.967% of the entire basket)... +0.45% MoM (was 0.33% in October). Shelter consists of two main components: (i) rent of primary residence (7.658% of the basket) +0.48% MoM and (ii) Owner's Equivalent Rent of Residence (25.825% of the basket) +0.50% MoM, Rent of Primary Residence is the rental charge which consumers pay to rent their primary residence. OER is the rental equivalent homeowners expect to be paid if they were renting out their own home in the market. 2) Medical Care Services (6.339% of the basket)... and here is the problem +0.60% and this is the strongest growth in 13 months. The annual change is still negative (-0.88%), but prices have been rising for 4 months now, 3) Transportation Services (6.050% of the basket) … +1.06% MoM, the strongest in two months. Annual change as much as +10.09%. 3-month annualized rates (Figure 2 and Figure 3): Shelter +5.86% (+5.19% in October), Rent of Primary Residence +6.04% (+6.05% in October), Owner's Equivalent Rent of Residence +6.01% (+5.51% in October), Medical Care Services +5.08% (+2.83% in October), Transportation Services +10.83% (+14.81% in October).


US core inflation Nov-2023

12-Dec-2023. Core Inflation (79.617% of the total basket) consists of two main series: 1) Core Commodities (20.914% of the entire basket)… -0.30% MoM and this is the 6th month in a row with a negative change. Annual change -0.04% (was +0.02% in October and -0.03% in September)! 2) Core Services (58.703% of the basket)… +0.47% MoM… a bit much, if we ignore the monthly change for September (+0.57%), it would be the highest monthly increase since March 2023. Core Services YoY +5.49% (was 5.51% in October). 3-month annualized rates (Figure 2): Core Inflation +3.39% (+3.36% in October), Core Commodities -3.08% (-2.28% in October), Core Services +5.66% (+5.31% in October).

US PCE inflation Nov-2023

22-Dec-2023. Headline PCE inflation decreased 0.07% in November (0.0% expected), YoY rose by 2.64% (2.8% expected). So quite on the soft side. Core PCE monthly change was +0.06% and YoY +3.16%. PCE inflation is strongly correlated with CPI inflation (Figure 1 and 2). On a monthly basis, headline PCE was negative for the first time since the Covid recession (Figure 3). In the case of Core PCE, the last 3 months even look much better than CPI inflation (Figure 4). This is also clearly visible in the case of core inflation 3-month annualized rates (Figure 5). A rate cut in March is practically certain (right now 88% probability implied by 30-Day Fed Funds futures), although by March 20 we will get three more CPI readings and two PCE ones. Looking at the nowcast inflation (Cleveland FED), as of yesterday for the hedaline CPI we have a rebound in December to 3.33% (from 3.12% in November), and a decline in the case of core CPI to 3.93% (from 3.99 % in November).


USDec-2023 CPI Review

12-Jan-2024. US December 2023 Inflation. At first glance, inflation turned out to be hot, and indeed there is nothing in the data that could accelerate rate cuts, but there is also nothing that could reduce the scale of rate cuts this year. Similarly, the first market reaction was negative, but by the end of the session everything generally returned to the levels before the data were published. When analyzing inflation, it is important not only to look at the year-to-year change (this is history, but the market reacts to it anyway), but also at the change in inflation over shorter periods, e.g. over the last 3 months. Figure 1 shows both the 3-month change (Y-axis) and the year-to-year change (X-axis) on one graph. Since Energy is a bit off the scale, Figure 2 shows the same series without Energy (for the last 5 months). While the 3-month change in the headline inflation quickly dropped from 4.88% (September) to only 1.79% in December - the annual change does not want to go towards 2% and has not managed to break down below 3% so far. In the case of core inflation, we have even seen an increase in recent months on a 3-month basis (from 2.41% rate to 3.33% - despite a decline in the annual dynamics from 4.39% to 3.90%). It is clear that Core and Food inflation are quite sticky. Yet, in the case of core inflation, we can count on strong base effects from May 2024 (May 2023 will drop from the annual dynamics (+0.44%), and in June 2023 core inflation amounted to only 0.16% and also 0.16% in July 2023 – see Figure 3, lowest panel). Base effects in the case of Food will support us from February 2024 (the +0.39% Feb-2023 print will fall out of the annual dynamics, and in March 2023 Food inflation amounted to only 0.01%, and 0.02% in April 2023 - see Figure 3. All in all, core inflation may be much closer to the Fed's target by mid-year.


USDec-2023 PPI Review

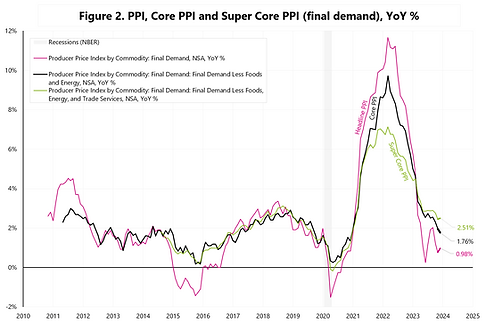
14-Jan-2024. US PPI is really deflationary! US PPI Inflation – A little more on this topic just to highlight how deflationary PPI inflation is currently. The start of the Fed's rate cut cycle in March 2024 seems virtually certain. Figure 1 simultaneously compares the annual and 3-month (annualized) change for headline PPI, core PPI, super core PPI, headline CPI and core CPI. If the data series moves downwards over time, it means that the 3-month inflation rate is decreasing. If the data series moves to the left, it means that the annual inflation rate is decreasing. Ideally, the data series is moving towards the inflation target, defined here as a rate below 2%. In the case of headline PPI: the 3-month rate was -4.79% in December, and the one-year rate was +0.98%. In the case of core PPI: the 3-month rate was -0.83% in December, and the annual rate was +0.98%. In the case of super core PPI: the 3-month rate was +1.00% in December and the one-year rate was +2.51%. Figure 2 shows the yearly changes in headline PPI, core PPI and super core PPI. Meanwhile, Figure 3 shows monthly changes in headline PPI, core PPI and super core PPI (in this case, these are seasonally adjusted series). In the case of monthly headline PPI, we have strong deflation for the last 3 months, and in the case of core PPI, no inflation at all. Only in the case of super core, the monthly change in December slightly rebounded and amounted to +0.22%.


Dec-2023 Inflation Wrap-up

22-Jan-2024. US inflation in one chart. Figure 1 shows what has happened with US CPI, PCE and PPI inflation over the last 5 months (4 months for PCE inflation, in this case the data for December will be available only on Friday, January 26). The X-axis shows the YoY rate, and the Y-axis the 3-month (annualized) rate. The problem with higher inflation is in three places: (i) core services, (ii) food away form home, and (iii) energy services. Energy services is part of Energy inflation and only makes up 3.27% of the total basket, but it shows where inflation is hotter (services). The last 3 monthly changes were as follows (Oct, Nov, Dec): +0.46%, +1.73% and +0.93%. This gives a 3-month annualized inflation rate of as much as 13.2%. Figure 2 shows the same inflation series, but without the three Energy series (for better visibility). In the upper right corner, you can see the two hottest series: core services and food away form home. Food away from home is only 4.87% of the entire inflation basket, while core services is as much as 59.06%.


US Dec-2023 PCE Inflation

26-Jan-2024. US December PCE Inflation. Now the FOMC may cut rates as early as March. On a 3-month basis (annualized rate), inflation dropped to: Headline PCE: +0.50% Core PCE: +1.52% Super Core PCE: +2.08% - practically every series is at or below 2%! On a 12-month basis, i.e. YoY: Headline PCE: +2.60% Core PCE: +2.93% Super Core PCE: +3.32% According to Inflation Nowcast (Cleveland FED), YoY inflation will be in January 2024: Headline PCE: +2.19% Core PCE: +2.66% Figure 1 shows 3 series of PCE inflation on an annual and monthly basis. Figure 2 shows both the annual and 3-month change for the last 5 months. Figure 3 shows the same for CPI inflation.


US Jan-2024 CPI Preview

13-Feb-2024. With no tier 1 data in the US all the focal point is about today's CPI print. Subjective market review (13-Feb-2024). In the US we got the January federal budget numbers (in line with expectations) and NY FED survey of consumer inflation expectations with the slight improvement on 3Y time horizon (3-year expectations fell to 2.4% from 2.6%, what is beneath the pre -2020 average of 2.9%) – but with little market reaction. The Cleveland FED inflation nowcast model indicates +0.13% monthly headline inflation (consensus +0.2%), and +2.94% on YoY basis (consensus +2.9%). This model’s reading means that the 3-month annualized rate for headline inflation will increase to 2.14% from 1.79%. In the case of core inflation nowcast, the model indicates +0.32% MoM (Wall Street consensus +0.3%) and 3.81% YoY (consensus +3.7%). This reading means that the 3-month annualized core inflation rate will increase from 3.33% to 3.72% - see Figure 1. In the case of the federal deficit, in January it amounted to $21.93 billion (a year ago in January it was $38.78 billion). On a 12-month basis, the deficit as a % of nominal GDP decreased from 6.38% in December to 6.32% in January. Government spending amounted to $499.25 billion in January (a year ago in January, $486.07 billion). On a 12-month basis, spending as a % of nominal GDP increased from 22.57% in December to 22.61% in January. See Figure 2.


US Jan-2024 CPI Review

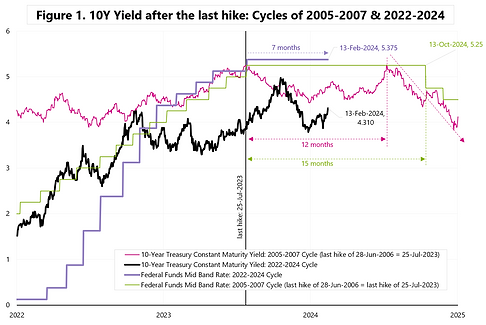
14-Feb-2024. How much the hot CPI has changed the base-case macro scenario? Not too much! Subjective market review (14-Feb-2024) and my key takeaways from the hot US CPI print: 1) in the optimistic variant, hot inflation moves the main macro scenario forward by 1-2 months (assuming that inflation related to broad services occurred "once" in January, as a fairly standard effect of increasing prices at the beginning of the new year (such effect occurs in most countries), 2) and in the pessimistic variant (several months of higher services inflation, not only in January), the main macro scenario (i.e. completion of the current business cycle) is moved forward by 3-4 months. In this variant, the chances of a hard landing at the end of the year or after US elections in Q1 2025 increase, 3) now there is a growing chance of a correction on the S&P500 similar to the one under the previous H4L (higher for longer) market narrative from August - October 2023 - but at the moment I assume that one month of hot inflation is still not enough for a drawdown of 10.3% (as in 2023), 4) the situation is becoming more and more similar to the long FED pause in 2006-2007 - when the acceleration of growth in H1 2007 extended the pause up to 15 months (today's equivalent is the first rate cut only in October 2024 - see Figure 1), and the 10Y yields of US Treasuries returned at the end of the pause in 2007 to the previous highs seen around the last rate increase in June 2006. In 2007, the long pause was quite beneficial for the stock market, with the S&P500 rising a total of 25.6% from the last rate hike to the top of the cycle - see Figure 2. But then we didn't have the same inflation problem as we do now. 5) the current correction (both in stocks and bonds) may well fit into the subsequent recovery of markets before the US elections.

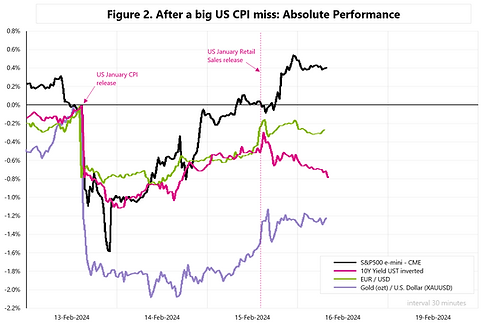
15-Feb-2024. Is a big miss on US CPI a big nothing-burger? Subjective market review (15-Feb-2024). At least in the case of stocks (S&P500 e-mini futures), this is what it looks like two days after the publication of US inflation. See Figure 1. In the case of gold, it is the worst, the price only made up for some 20% of the decline after the inflation release. But let's give the market a few more days to fully react and see if this inflation reading can be so easily swept under the carpet. Tomorrow we will get the US PPI and at the end of the month the PCE inflation. Cleveland FED inflation nowcast indicates a headline PCE reading of +0.26% MoM and 2.30% YoY (before the CPI publication it was 2.16%). After the publication of the CPI, the Core PCE inflation nowcast for January 2024 jumped 8.1 bps (from 2.66% to 2.74%).

16-Feb-2024. US CPI miss still a nothing-burger for stocks, but not anymore for bonds. Subjective market review (16-Feb-2024). On the fourth trading day after the publication of US January inflation, the stock market completely ignored it and we are now above the levels when the inflation was released - see Figure 1. I assume that ultimately the stock market may ignore inflation even to levels of 4.5% for Core CPI (currently 3.87%). Figure 2 is the same chart, but in absolute percentage terms. While stocks can ignore inflation for longer, bonds cannot. Currently, 10Y yield is around 4.27% (was 4.15% at the time of inflation publication). On the charts there is the price of 10-year bond (T-Note) to more easily show the percentage change. So the price of the 10-year bond only recovered about 30% of its decline. Bonds were also not "fooled" by yesterday's retail sales data, which turned out to be so weak mainly for technical reasons and it is unlikely there is a change in the trend in the spending of the American consumer (seasonal adjustments had a strong effect, and not only for January itself (in January and in February they are the highest in the whole year), but also as a payback after too favorable adjustment factor in December; additionally the cold weather in January probably also had an impact on the decline in sales). In order for stocks to react negatively to the inflation reading, in my opinion, another miss/shock of a similar size is needed as in the case of January's inflation, and such a chance is likely only with the inflation reading for February 2024 (publication only on March 12). PCE inflation for January published at the end of February should no longer surprise the markets. Cleveland FED Inflation Nowcast indicates headline inflation for February at 3.06% YoY and 0.37% MoM (in January it was +3.11% and +0.305%), and in the case of Core CPI +3.70% YoY and + 0.32% MoM (in January it was +3.87% and +0.39%).

US Feb-2024 CPI Preview

11-Mar-2024. US February Inflation Preview. The key data this week is tomorrow's inflation in the US. As a reminder, in January we had a very strong increase in employment, wage inflation and consumer inflation (CPI). After the February employment report, it turned out that January was an aberration both in terms of employment growth and wage inflation. I am attaching my two favorite charts from the labor market... (Figure 1 and 2). Will it be the same with inflation? Will the reading for February also indicate January as a departure from the trend? The key in tomorrow's report will be: (1) monthly change in core CPI: +0.3% M/M neutral, +0.4% hawkish and confirmation of the inflation pressure from January, +0.2% M/M dovish (i.e. January was an aberration) - see Figure 3, (2) OER (owner's equivalent rent of residences) inflation, was the jump in January to 0.6% M/M an aberration? Especially since it was inconsistent with Rent Inflation (rent of primary residence), which increased only 0.4% in January - Figure 4 (as a reminder, Rent of Primary Residence is the rental charge which consumers pay to rent their primary residence; OER is the rental equivalent owners expect to be paid if they were renting out their own home in the market), (3) You can also look at Core Goods M/M inflation tomorrow to see if it will accelerate... and some opinions from Wall Street express such concern... - Figure 5.


Feb 2024 US PCE

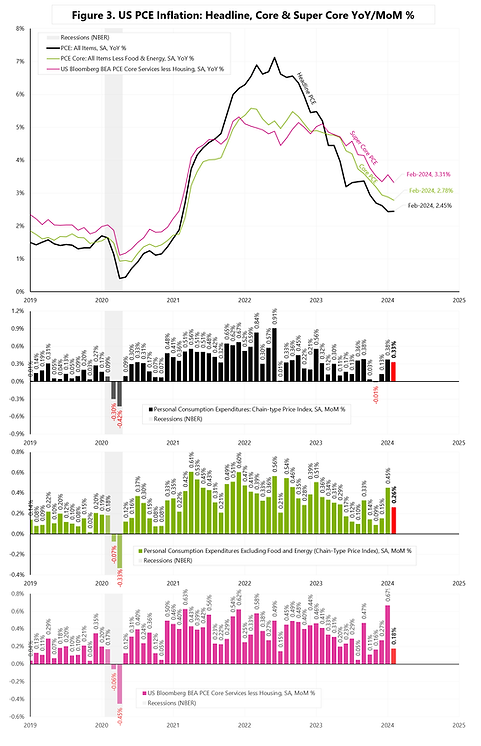
1-Apr-2024. To start the week: Waller, Powell & PCE Inflation. It will be interesting to see whether the markets can completely ignore the hawkish speeches of Waller (last Wednesday) and Powell (Friday), and the hot February PCE inflation (Friday). PCE turned out to be in line with expectations (no surprise after February CPI and PPI), but it is difficult to say that we are on a fast track to the 2% target. All in all, there is a risk that the FED will not cut rates in June - this will depend on inflation data for April and May. Waller: „PCE inflation jumped to 0.4 percent on a monthly basis in January, after averaging around 0.1 percent in October through December last year. And with February consumer price index (CPI) and producer price index inflation data in hand, some forecasts are predicting core PCE inflation may be revised up for January and is expected to come in at 0.3 percent for February, which we will learn about on Friday”. And unfortunately, for January we had an upward revision of core PCE (from 0.4156% to 0.45218%), in February core PCE was 0.2615%. Waller: ”In trying to judge what the underlying trend is for inflation, I tend to look at annualized core measures over 3 or 6 months. (..) These shorter-term inflation measures are now telling me that progress has slowed and may have stalled”. After February's data, 3-month core PCE is 3.52% (it was 1.55% in December), and 6-month core PCE is 2.89% (it was 1.88% in December) – Figure 1. Figure 2 shows YoY and monthly changes. 12-month core PCE is 2.78%. Waller: “I see no rush in taking the step of beginning to ease monetary policy. (…) The risk of waiting a little longer to cut rates is significantly lower than acting too soon. (…) As a result, in the absence of an unexpected and material deterioration in the economy, I am going to need to see at least a couple months of better inflation data before I have enough confidence that beginning to cut rates will keep the economy on a path to 2 percent inflation. Fortunately, we can wait to see how the data come in before deciding the appropriate time to start lowering the policy rate”. Powell on the first cut: “(…) with the economy you know growth is strong right now, the labor market is strong right now, and inflation has been coming down we can and we will be careful about that decision because we can be. (…) I think we are in position now where we can handle whatever case comes.” “I don’t think rates will go back down to the very very low levels they were at before the pandemic (…) this economy doesn’t feel like it’s suffering from the current level of rates” Powell on recession: “ (...) there’s always a sort of unconditional probability of a recession in the next year so the real question is if you look through history it’s not possible to rule a recession out for a long period of time so … is the possibility of a recession elevated at the current time and I would say no (…)”. Figure 3 shows the main PCE inflation series.


March 2024 US CPI

11-Apr-2024. The Inflation Day My key takeaways after the next inflation day: 1) Red-hot inflation is bad news for short-term investors, the fourth monthly CPI reading in a row is a negative surprise and once again we have a strong jump in the yield of 10-year UST - see Figure 1. It may also be the beginning of a deterioration of the good sentiment on the stock market, which should get the message from higher interest rates at some point… 2) But for investors with a medium investment horizon, the second half of 2024 may bring positive surprises in terms of lower inflation, weaker growth, falling bond yields and greater chances for a soft landing scenario 3) In the current cycle, the market is completely unable to predict inflation, and therefore the path of Fed rate cuts, so it is difficult to assume that after yesterday's inflation it is any better... see Figure 2, as a reminder: - March 24, 2023, the epicenter of the regional banks crisis, which turned out to be a nothing-burger - the market was pricing in the first rate cut already in June 2023, - October 17, 2023 - the epicenter of the HFL (higher for longer) narrative, 10Y UST yield was 5%, the market estimated the first cut only in August 2024. Then, it was the perfect time to buy long US treasuries, e.g. iShares TLT ETF - which delivered a return rate of approximately 22% in the next 2 months, - January 12, 2024 - the market priced in 7 rate cuts by the FED in 2024 - April 10, 2024 - the market estimated only 1.5 rate cuts in 2024 4) Yesterday's inflation is a big problem for political incumbents in an election year. Bloomberg's Chris Antsey: “Obviously, this is very bad news for Joe Biden. It’s still only April, and we’ll have another half-a-year’s worth of inflation reports before the election. But we’re approaching the point where high inflation is bound to still be in voters’ minds when they head to the polls, regardless of how the price figures come in over summer.” President Biden joined the public discussion on rate cuts yesterday: "Well, I do stand by my prediction that, before the year is out, there'll be a rate cut. This (March inflation report) may delay it a month or so, I'm not sure about it. We don’t know when the FED is going to do for certain.”


US Inflation Expectation

10-May-2024. US Inflation Expectations vs Headline & Core CPI On May 15, we will get what is probably the most important data this month… US April CPI. Cleveland FED inflation nowcast expects YoY headline CPI at 3.50% (Bloomberg average consensus is now at 3.39%). In the case of Core CPI Cleveland FED model expects 3.65% (Bloomberg average 3.62%). Today we got the University of Michigan Inflation Expectation… 1-year ahead increased to 3.20% - see Figure 1. A jump in expectations of 60 bps in 2 months does not look good, but historically we have already had similar increases without affecting the current inflation: +130 bps in two months (Sep-2023 to Nov-2023), and +110 bps (Mar-2023 to Apr-2023). Figure 2 additionally presents the New York FED Median one-year ahead expected inflation rate (Survey of Consumer Expectations). The New York FED series correlates well with the University of Michigan series, but interestingly there was no increase in expectations at all in the period of Sep-2023 to Nov-2023. Figure 3 shows the average of U. of Michigan & New York Fed inflation expectations. Now, let's check longer term inflation expectations. Figure 4 shows long-term inflation expectations for both the University of Michigan and New York Fed data series. Ok, there is a 30 bps jump in Un. of Michigan series – but I'm not sure if this has any greater meaning … Either way, the most important data will be the CPI for April, published on May 15 (and the PPI will be released the day before).


April 2024 US PPI & CPI

15-May-2024. PPI review / CPI preview After all, PPI inflation, despite initially some hot headlines, turned out to be less scary at the end of the day and in fact we had a positive market reaction - which we have not had for many months in the case of PPI and CPI inflation releases (Figure 1). Yields of 10-year bonds fell by 5 bps from the PPI release until the end of the day... and shares (S&P500) rose by 0.5% at the end of the session to new highs (counting from the April lows). Today we see a further decline in the yields. PPI inflation measures the average change over time in the selling prices received by domestic producers for their output. The prices included in the PPI are from the first commercial transaction. PPI is strongly correlated with CPI - see Figure 2, but there are also significant differences in the composition of the indices. PPI doesn't measure housing prices/costs, and in the case of CPI it is as much as 1/3 of the entire basket (Shelter). Shelter inflation may drop significantly in the coming months and could even subtract up to 1 percentage point from the headline YoY CPI (detailed analysis here). PPI includes export prices and does not include import prices. Yet, CPI measures prices of imported goods. There is also a big difference in healthcare services as PPI includes third-party reimbursements. In the case of PPI health services it is about 17%, and in the case of CPI medical care has a weight of only some 8%. What the market expects from today's CPI inflation: Headline CPI MoM change +0.37%, core CPI +0.30% And Headline CPI YoY change +3.40%, core CPI +3.60% A possible positive surprise may show up in the Shelter inflation... see Figure 3. A monthly change of 0.35% could be quite well received by the market. Bonus chart – yesterday we got the results of the NFIB small biz survey on future pricing plans… and net percent of those planning to raise selling prices in the next 3 month dropped from 33% to 26% - see Figure 4.


US shelter inflation Apr-24
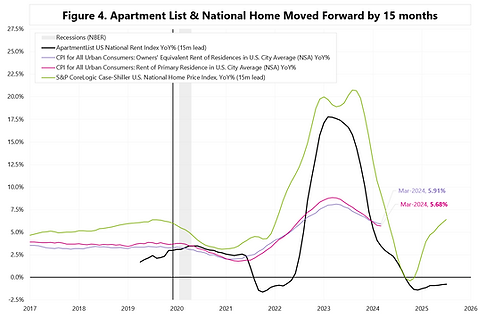
13-May-2024. Is the Shelter Inflation key in coming months? Could Shelter Inflation bottom in October-November this year? Just at the moment of US election… Today's YoY inflation is 3.50%, of which the Shelter contribution is as much as 1.971 percentage points (in other words, as much as 56% of the annual change in inflation is just Shelter). If Shelter falls from today's 5.7% to 2.5% in October this year – headline inflation would be below 2.5%, ceteris paribus. Shelter is 36.184% of the entire basket and consists of the following components: (i) Rent of Primary Residence (7.639% of the basket) and (ii) Owner's Equivalent Rent of Residence (26.713% of the basket), (iii) Logging away from Home (1.422% of the basket), (iv) Tenants' and Household Insurance (0.410% of the basket). Rent of Primary Residence is the rental charge which consumers pay to rent their primary residence. OER is the rental equivalent homeowners expect to be paid if they were renting out their own home in the market. These two series measure the market change in rents, but for all housing units. All units is key here. But the changes in new rents are strongly leading. E.g. Apartment List National Rent Index captures price changes in new leases, which are only later reflected in price changes across all leases. Figure 1 shows the change in rents since December 2019, while Figure 2 also shows the change in national home prices. Evidently, both new rent prices and home prices are significantly ahead of changes in rents in CPI inflation. Figure 3 shows the YoY changes. However, in Figure 4, the Apartment List Index and the National Home Price Index have been moved forward by 15 months. Figure 5 is key here. Changes to the Apartment List Index and the National Home Price Index are now on a separate axis... And they suggest a decline in Shelter inflation to levels of approximately 2.5% YoY in October 2024. In other words, one can expect headline inflation to decline by as much as about 1 percentage point by October this year - solely due to the drop in Shelter Inflation!



Apr-2024 CPI US vs Canada

21-May-2024. Inflation: US vs Canada Today we got the inflation data for April in Canada. Headline inflation decreased from 2.90% in March to 2.69% in April (YoY). The desinflation process north of the USA is accelerating! It's a good sign. As recently as December 2023, the difference between inflation in the USA and Canada was only 5bps. In April 2024 it is already 67 bps - see Figure 1. Core inflation looks even better, the difference between the US and Canada is already 95 bps in April! See Figure 2.


USA: May-2024 CPI

12-Jun-2024. This is it! Dovish US CPI! As I wrote for some time: (i) it is difficult to forecast inflation, much less its monthly changes - e.g. JPMorgan gave only a 2.5% chance for core inflation to print below 0.2% in May - and it turned out to be 0.16% MoM - see Figure 1, second panel from the top; (ii) it is easier to forecast, as I have written for some time, that such a very dovish report will be published within the next 3-4 months - it was published today... (iii) shelter inflation has not dropped (yet), the monthly change is still +0.40% - and this is good news - there is potential for further dovish reports in the coming months - Figure 2 and 3. Figure 4 additionally shows the leading series of the ApartmentList; (iv) contribution to the monthly CPI change: Figure 5 shows the contributions with details of services inflation (core commodities and core services), in addition Figure 6 shows the Energy and Food contributions. On both an annual and monthly basis, Shelter is by far the largest positive contributor… (v) Such a CPI report is a complete comfort for the FED - but they did not want to show it today, neither in the projection (the projection is hawkish with only one cut in 2024), or especially during the press conference; (vi) All in all, for the market the macro data itself should remain more important than the FED and its forward guidance + the valuation of the next pivot option, such as the one from December 2023.


USA: June-2024 CPI preview

10-Jul-2024. US CPI Preview CPI inflation for June is a very important data point for markets. It may confirm disinflationary processes - because according to consensus, this may be the second month in a row of dovish readings. Wall Street expects only +0.07% MoM for headline inflation – Figure 1. In May, the monthly change was only +0.01%. A reading of 0.07% will bring the annual inflation rate down to 3.11% (from 3.25% in May, seasonally adjusted series). For core inflation, Wall Street expects +0.22% (after a fantastic May of +0.16%). Such a reading will slightly increase the annual core inflation from 3.41% to 3.44% (applies to the seasonally adjusted series). Attached a graphic with Wall Street expectations (source: Wall Street Journal).


USA: June-2024 CPI review

12-Jul-2024. US June CPI Review. A month ago, commenting on inflation for May 2024, I wrote that it was good news that core inflation for May was only +0.16% (expected +0.26%), but even better news is that it did not happen thanks to Shelter inflation, which in May did not even move down and amounted to +0.40%. Why? Because it can be expected that Shetler will drop significantly in the coming months, dragging down the entire core and headline inflation. Link to comment from a month ago: https://www.jamkaglobal.com/post/this-is-it-dovish-us-cpi And this is exactly what happened in the data for June, where Shelter inflation increased only +0.17% MoM - which is the smallest increase since January 2021! - see Figure 1. Importantly, this may be only the beginning of a trend - see Figure 2. If Shelter is similar in the next two months, it could be possible that the Fed will reduce interest rates at the September meeting by 50 bps! The market currently does not price in this option at all. Another good news is low core inflation for the second month in a row - see Figure 3. Similarly, when it comes to headline inflation - see Figure 4.


